For product requests contact us by using the
- Contact formular,
- Email (sales@suragus.com) or
- Phone (+49 351 32 111 520).
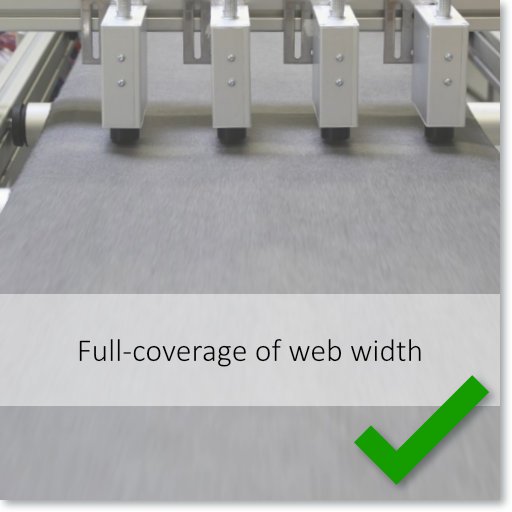
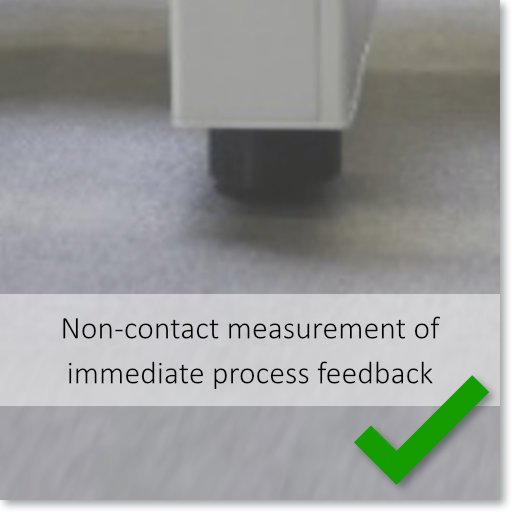
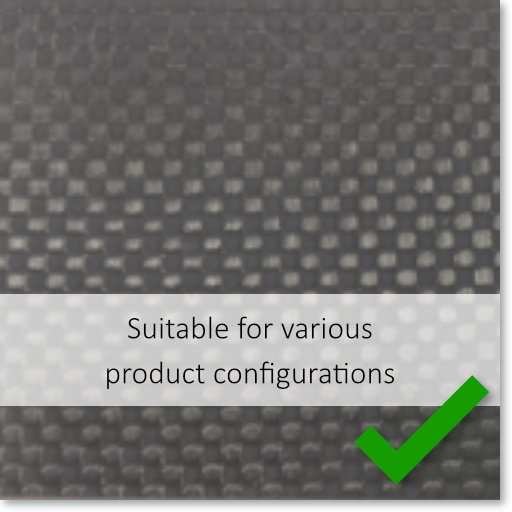
Online process monitoring allows immediate feedback and closed-loop manufacturing of carbon fiber materials. The EddyCus® inline ISO provides isotropy data for the continuous roll-to-roll process of recycled carbon fiber, UD-tapes or similar configurations. The solution offers real-time data across the entire width of the web at a competitive price.
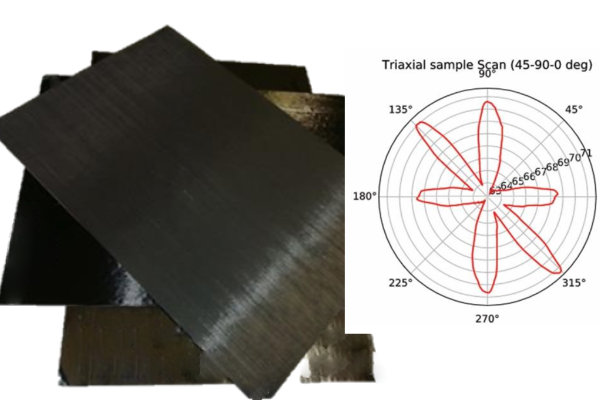
The EddyCus® inline ISO is an inline solution for recording the fiber orientation and fiber areal weight of each fiber layer of an entire stack. This allows you to react immediately and realign the layers as soon as deviations from the target are detected. The monitoring system can monitor the fiber layer at various angles e.g. 0°, 90°, -45° or 45° at one or more lanes at a single point. It compares the polar plot of a reference with the polar plot of a currently produced ply, checking the difference in the angles of the inflection points and also the length of the plots. This gives you the information you need to determine the quality of the product and monitor the production process – the orientation of the layers and the fiber area weight of each layer. The picture on the right shows an example of a possible visualization of a two-layer stack. The black line shows the expected values determined by a reference and the red line corresponds to the values of the measured stain.
How can the polar diagram shown on the right be interpreted?
The example is constructed, but it shows how easy it is to interpret the data using the SURAGUS solution.
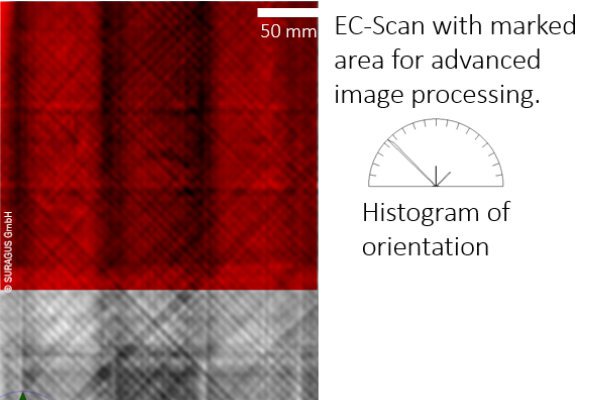
By using SURAGUS sensors, the individual, real bonded plies can be virtually separated from each other and analyzed. The sensor signal penetrates deep into the carbon fiber ply and can distinguish up to 10 plies. The separation works primarily by fiber orientation. If there are several plies with the same fiber orientation, the separation of a single ply is no longer possible. Instead, the layers with the same fiber orientation are combined. This procedure comes closest to the real requirements of the material.
SURAGUS sensors only take into account the carbon fibers. The resin or any other adhesive is not detected by our sensors.
Fiber orientation is one of the most important properties of a carbon fiber component loaded in tension. The fiber orientation directly determines the load limit. This is why the correct angle of the bonded plies is so important.
SURAGUS sensors are adjusted and optimized for the angle to be detected. Each angle to be examined receives its own sensor. The distances between the individual sensors are calculated out to obtain a result that is accurate to the point.
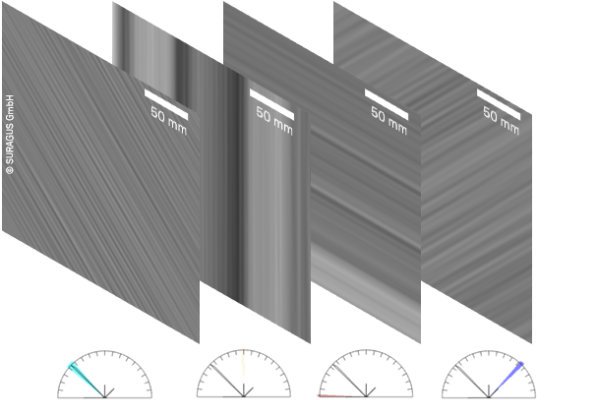
The SURAGUS sensors detect two main measured variables. The angle and the strength of the signal. The strength of the signal allows conclusions to be drawn about the amount of material in the direction under consideration. As shown in the picture, a higher amplitude means a higher surface weight and a lower amplitude means less surface weight. Through our sensors, they will not be able to determine the exact basis weight. Our sensors are calibrated to a target value and relate the measured material to the target value.
How well this works depends very much on the composition. If several layers point in the same direction this is challenging for the analysis. The concept works very well in this case, but due to the missing possibility to separate the layers, only the total weight per unit area can be displayed. This leads to the fact that no recommendations for action can be derived to bring the process to the target values. Contact us to evaluate the applicability in your application.
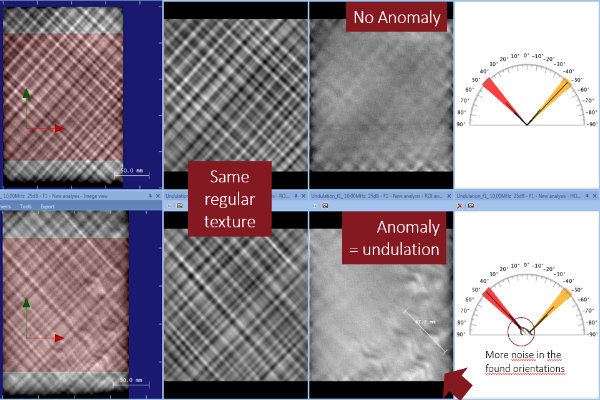
By separating the different layers, individual defects within a layer can be detected. These include gaps or, as shown in the image on the right, waves.
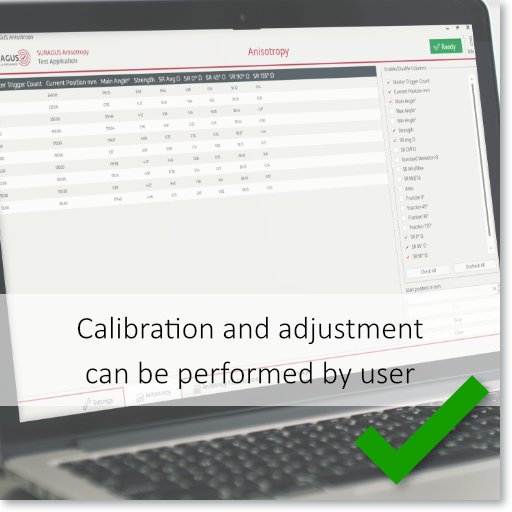
The software is easy to use and clearly displays the recorded values. A report can be created for each roll and can be handed over to the customer as proof of quality.
To give you an idea of the performance of eddy current technology, we offer you a free demo measurement.
The process goes something like this:
For more information please watch our data sheet or contact us by email.
| Measurement technology | Non-contact high frequency eddy current sensor |
| Measurement area | 20 mm in diameter |
| Required space | Small - approx. 300 mm in production line |
| Sample rate |
1–50 measurements per second 1 measurement/mm @ 5 m/min production speed |
| Interface | Process control with uplink to PLC or production control system via UDP or TCP/IP and API integration |
| Value propositon |
Degree of Isotropy (maximum orientation / min orientation Ratio MD/CD - machine direction to cross direction Fiber weight distribution [g/m²] Fiber orientation in degree [°] |
| Carbon fiber materials | CF non-woven, CF chopped, recyled CF, CF mats airlayed; sprayed discontinous CF with theromplastic or thermoset matrix |
| Max. sample thickness | 15 mm (larger on request) |
| Web fluttering tolerance | 1 mm |
For product requests contact us by using the