Elektrische Anisotropy

Content Overview

Anisotropy Measurement by Eddy Current Testing | What is Electrical Anisotropy? | Measurement

Electrical Anisotropy Measurement by Eddy Current

Measure the electrical anisotropy of a foil at 4 lines with 2 eddy current sensors each.

The measurement of electrical anisotropy by eddy current anisotropy sensors allows the precise measurement the anisotropy strength and anisotropy direction without sample preparation or even contacting the test object. The key of this innovation is the induction of directed eddy currents into thin films and the subsequent determination of directed sheet resistances by electromagnet field (EMF) sensors. Anisotropy sensors and instruments save a tremendous amount of time since a measurement can be done in milli-seconds. Further benefits include

  • No sample preparation
  • Non-contact & non-destructive
  • Measurement through encapsulation
  • Determination of anisotropy strength
  • Determination of anisotropy direction
  • High repeatability and accuracy
  • Large anisotropy measurement range 0.25 to 4 (MD / TD, larger on request)

This technology is applied in industrial applications since 2015. The dedicated EddyCus SR-A series includes single point, imaging and inline devices. Those systems determine the directed sheet resistance in two or four directions and present the data as numbers, graphical bars or as anisotropy images.

Types of Devices for the Measurement of the Electrical Anisotropy

Single point electrical anisotropy measurement device based on eddy current technology for the measurement of conductive samples with a size of 200 mm x 200 mm
260 mOPS foil - drift compensation - manual mapping.jpg
Fast and precise high quality table desk electrical anisotropy mapping device based on eddy current technology for the measurement of conductive samples with a size of 300 mm x 300 mm such as wafers, glass with conductive layers, foils and others
High resolution mapping of an 8 in wafer with a 1mm pitch
Inline electrical anisotropy measurement system based on eddy current technology for the process quality and product quality monitoring of conductive products such as thin-films, coatings and materials
SURAGUS SUITE EC INLINE Measurement Screen.png

Terminology - What is Electrical Anisotropy?

Definition

The available definitions of electrical anisotropy are often addressing the background of its application. The general definition of electrical anisotropy describes the variation of an electrical property depending on the lateral or vertical direction (x,y,z) in which is a current flows. In other words, the term “electrical anisotropy” describes the directional dependence of the electrical conductivity or resistivity or other electrical terms such as sheet resistance or carrier mobility. The scale of anisotropy can be microscopic or macroscopic and even be different on small and large scale.

Concept and Terminology of Sheet Resistance Anisotropy


illustration of the anisotropy machine direction and traverse direction


  MD = Machine Direction                                       TD = Transversal Direction

RMD = Sheet Resistance in MD                            RTD = Sheet Resistance in TD

The anisotropy depends on the material, the process type and process parameters. There are isotropic or rather isotropic processes such as PVD or CVD processes. There are also high throughput processes such as slot die coating or curtain coating which generate anisotropy depending on process parameters such as speed or if measures are taken to reduce or increase anisotropy. Furthermore, there are also high anisotropic applications e.g. screen printing in PV industry where the metal meshes structures (fingers) are designed for efficient current transport towards the collectors. An overview in typical anisotropy rations is given here.

Isotropic processes RMD = RTD      
Anisotropic processes

RMD < RTD

RTD / RMD = 1.0 – 1.2 or 1.2 – 2.0

Forced anisotropic processes
(e.g. by mesh design)

RMD << RTD

RTD / RMD = 2 – 200 (and higher)

Calculation of Sheet Resistance Anisotropy

The relevant directions for anisotropy calculation are the minimum (Rdirection min) and the maximum (Rdirection max) sheet resistance direction. Most inline manufacturing processes tend to align the wires into machine direction when transferring wire or tube material onto moving web. Therefore, the best or minimum sheet resistance is present in machine direction. Consequently, the worst or highest sheet resistance is achieved into the traversing direction.  

Rdirection max =  RTD                                Rdirection min = RMD

Generally, the best sheet resistance direction Rdirection min is perpendicular to worst sheet resistance Rdirection max.

Rdirection max Rdirection min + 90 degree                                Rdirection min = Rdirection max + 90 degree      

There are two common ways to describe anisotropy. Either the ration between the lowest and highest sheet resistance is taken. An alternative way is the description of the difference of both directions divided by the average.

Relative Anisotropy =  RTD / RMD                            Anisotropy [%] = (RTD -  RMD) / ((RMD +  RTD) · 0,5)

Electrical Anisotropy in Transparent Conductive Materials.

Transparent conductive materials excel in electrical conductivity and in optical transparency at the same time. The challenge for TCM manufactures is that the electrical resistance can be improved by adding more material which is then worsening the transparency. Many companies compete for providing the best sheet resistance to transparency ratio. Nanowire, tube and mesh structure are able to provide outstanding SR to OT rations at good costs. There are some cases where the conductivity of a film is directed to the electrodes which results in even better SR to OT rations. The key points of this concept are shown here:

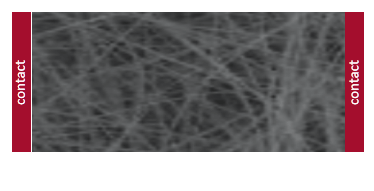
Anisotropic Wire Film

visualization of anisotropic wire film

Isotropic Wire Film

visualization of isotropic wire film
  • Anisotropy can be optimized according to the layout of the contact pattern
  • Anisotropy can save material and improve optical transparency 
  • Anisotropy can be measured in non-contact mode by EddyCus TF inline anisotropy sensor
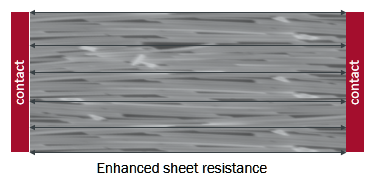
  • More of the conductive (and non-transparent) material is required in order to sufficiently supply this structure with current
 

Measurement of Electrical Anisotropy


systematic how to measure the electrical anisotropy


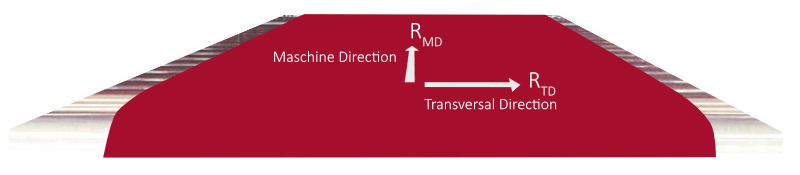
The measurement of the resistivity anisotropy may expose insights about the material structure and scattering processes in anisotropic and low-dimensional materials. Its anisotropy is affected by the geometry of conductors, its connection, the number contact points and length paths and the effective parallel resistances.

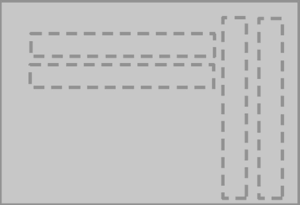
A difference in lateral (y,x) sheet resistance / resistivity / conductivity within a material or film can be measured by contact or non contact testing methods. Contact methods require the cut out of narrow and long material sections in a ration of 1 : 20 (eg. 1 cm x 20 cm). Here the direction of the cutout describes the direction measurement. The sheet resistance can be measured by contact measurement after applying contact pad to the material film. The nature of this setup results in the disadvantage that a measurement on the same position is not possible. The layout of possible cut outs is shown at the right.

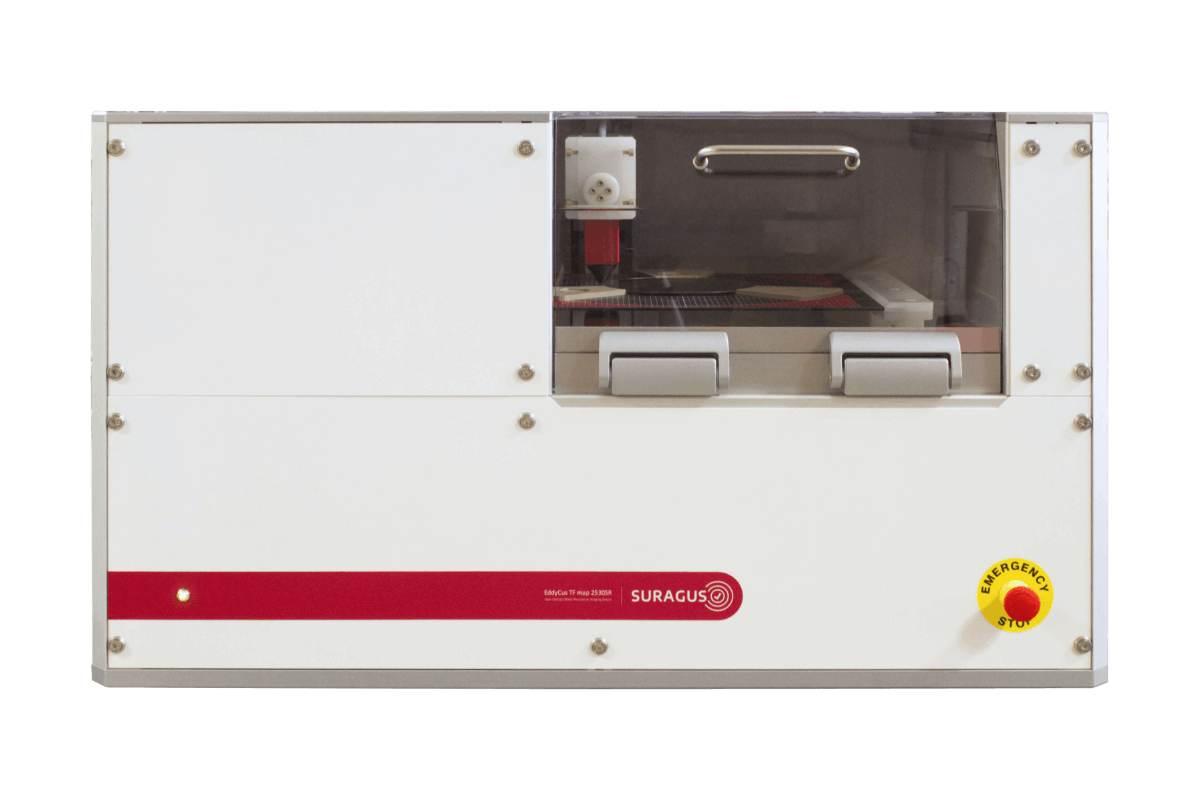
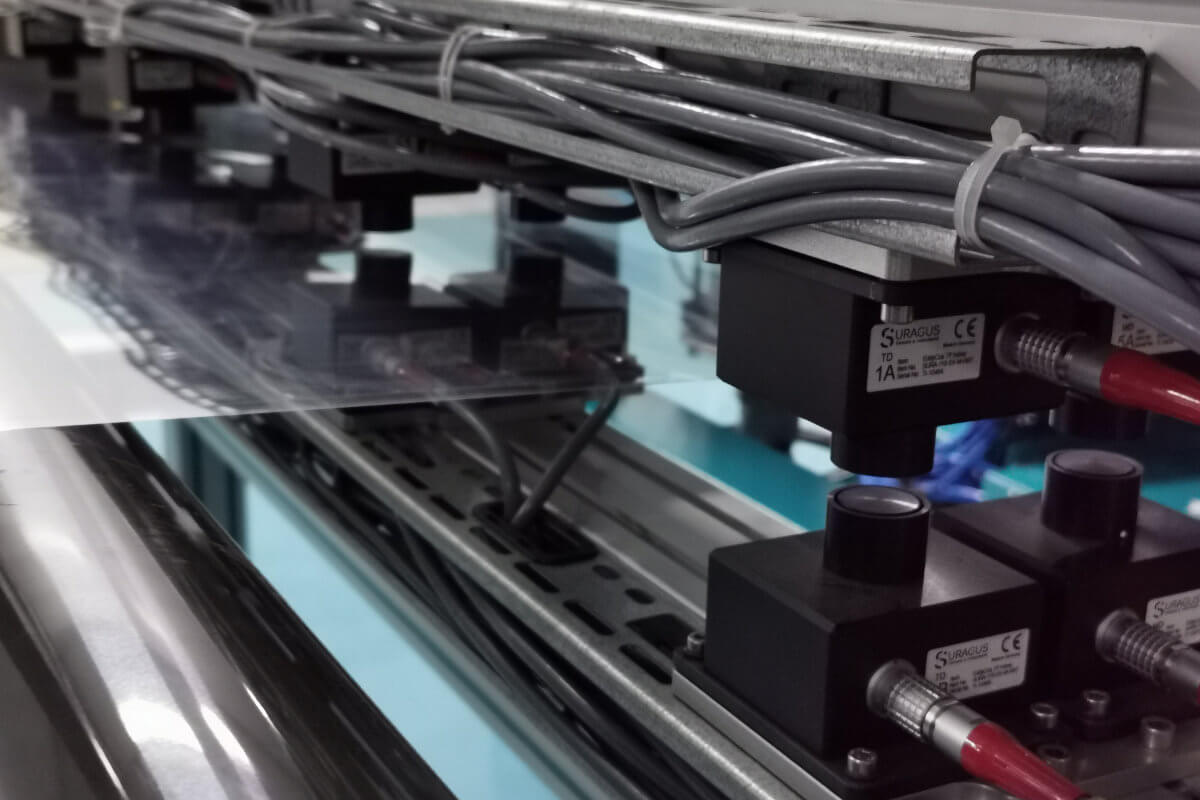
Non-contact measurement of electrical anisotropy is done by SURAGUS Eddy Current anisotropy sensors. Those are especially designed to induce currents in defined directions such as MD = Machine Direction | TD - Transversal Direction. There are single point measurement systems and imaging measurement systems proving in detail information on anisotropy strength and direction across the entire sample. Examples for sheet resistance anisotropy depiction are shown below. The first images  shows the individual sheet resistances RMD and RTD and the absolute and relative calculated values. The right image depicts the anisotropy distribution across a sample where blue represents anisotropic areas and red anisotropic areas. The black and white line image depicts the anisotropy strength as length of the lines where dots represent isotropic areas and long lines anisotropic areas. The direction of anisotropy is exposed by the direction of a line.

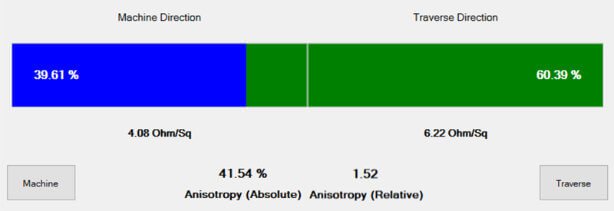
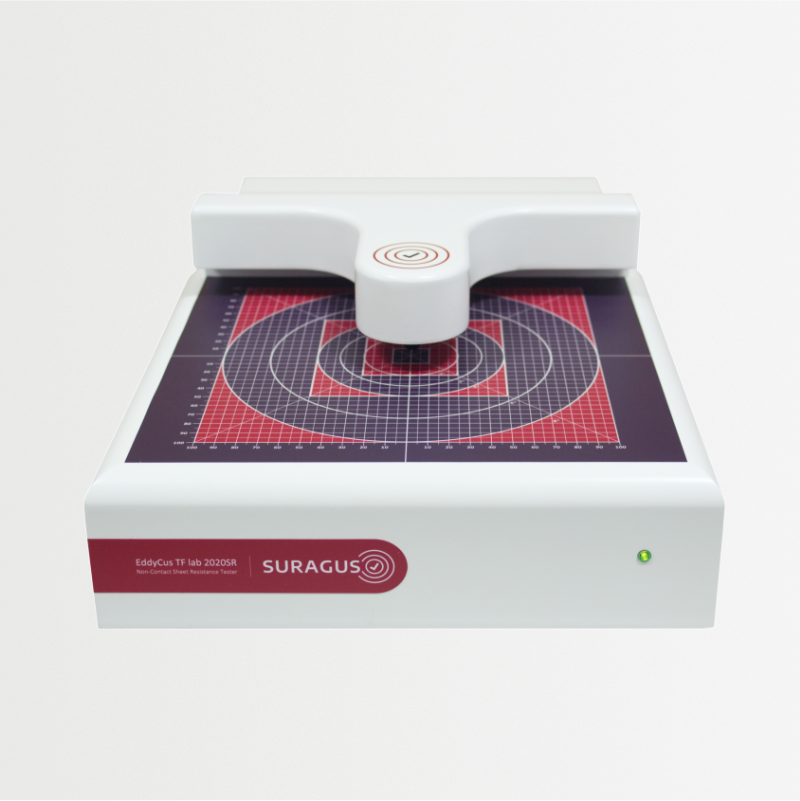
Single point / inline Imaging
Measurement of an electrical anisotropy with suragus software


Visualization of the distribution of the electrical anisotropy


Single Point Anisotropy Evaluation with Eddy TF lab 2020A Series
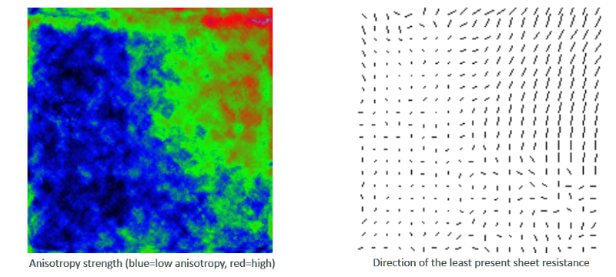
Anisotropy Image of Spray Coated Silver Nanowires.


Testing Devices for Anisotropy Measurements

Industry and R&D laboratories have different requirements according to number of measurement samples per day, measurement point density and automation level. In result, four key testing types are commonly applied

Contact

For product requests contact us by using the

For a prompt and informative response, please describe your measurement task (material, sample dimensions, expected measurement range) and provide your phone number.

By sending this form, I permit SURAGUS GmbH to process my data for contacting me. For more details see our Imprint & Privacy Policy